

The Premier League is still shitball — but midfield is king now
Analysing a "new" Premier League, and which FPL MIDs to pick now

I’m not going to beat around the bush—in the Premier League this year, we’re seeing noticeably less exciting football than in previous seasons.
A few months ago, Paul Tomkins popularised the term “shitball” to describe the trend of long-ball tactics, time-wasting, and anti-football in the EPL.
And it’s pretty fitting, if you ask me.
I published a deep dive on this topic after Gameweek 9 this season, and re-reading it now, I was spot on. Like, really spot on.
Aerials. Scary set pieces. DEFCONs. The big reveal behind FPL’s defensive boom (and how to adapt)

Note: This newsletter is truncated in an email. You can click on “View entire message” to see the full post in your email app.
As the title of today’s article suggests, my prediction that the trend of ugly Premier League football will persist throughout the 25/26 season is holding up so far.
Of course, I have some numbers to back it up.
If you’re reading this, there’s a good chance you share the same data-nerd blood type, so you probably won’t mind my taking a slight detour from FPL.
Don’t worry, I’ll talk picks after that.
It’s not just Arsenal. It’s everyone…
Jumping straight into it—there are fewer goals this season, and their distribution has changed dramatically.
You’ve guessed it.
There are many set-piece goals.
And there are far fewer open-play goals…
Note that throughout this article, I’ll be comparing the same Gameweek 1 to 23 period across the two most recent Premier League seasons.
While in the same period last year teams converted 677 of their attempts, this season it’s only 607, a 10% decrease in the total goal tally.
If you look at how those goals were scored, you’re getting this:
The 24/25 season:
499 open play goals
133 set-piece goals
47 penalties
The 25/26 season:
375 open play goals
185 set-piece goals
45 penalties
That goal distribution jumps right out at you. This season, there are 25% fewer open-play goals and 40% more set-piece goals.
That means 31% of all goals are scored from set pieces, compared with only 19.6% in the previous season.
Note that when you hear a data analyst talk about xG from set pieces, it includes not only shots directly from corners or free kicks but also situations where the defence clears the ball, the team wins the second ball, and then shoots.

These models often use time-based definitions, like “a shot within 20 seconds after the set piece is taken”.

It varies by data company, but you’ll get the idea.
Back in October, when we were in Gameweek9, I noted that in only one of the last five seasons did the average number of set-piece goals per GW decrease for the rest of the season, and that this happened five years ago.
We’re in GW24, and it seems it won’t happen this season either.
We are seeing a 108% increase in this…
Long throws are another huge trend you can read about almost every week.
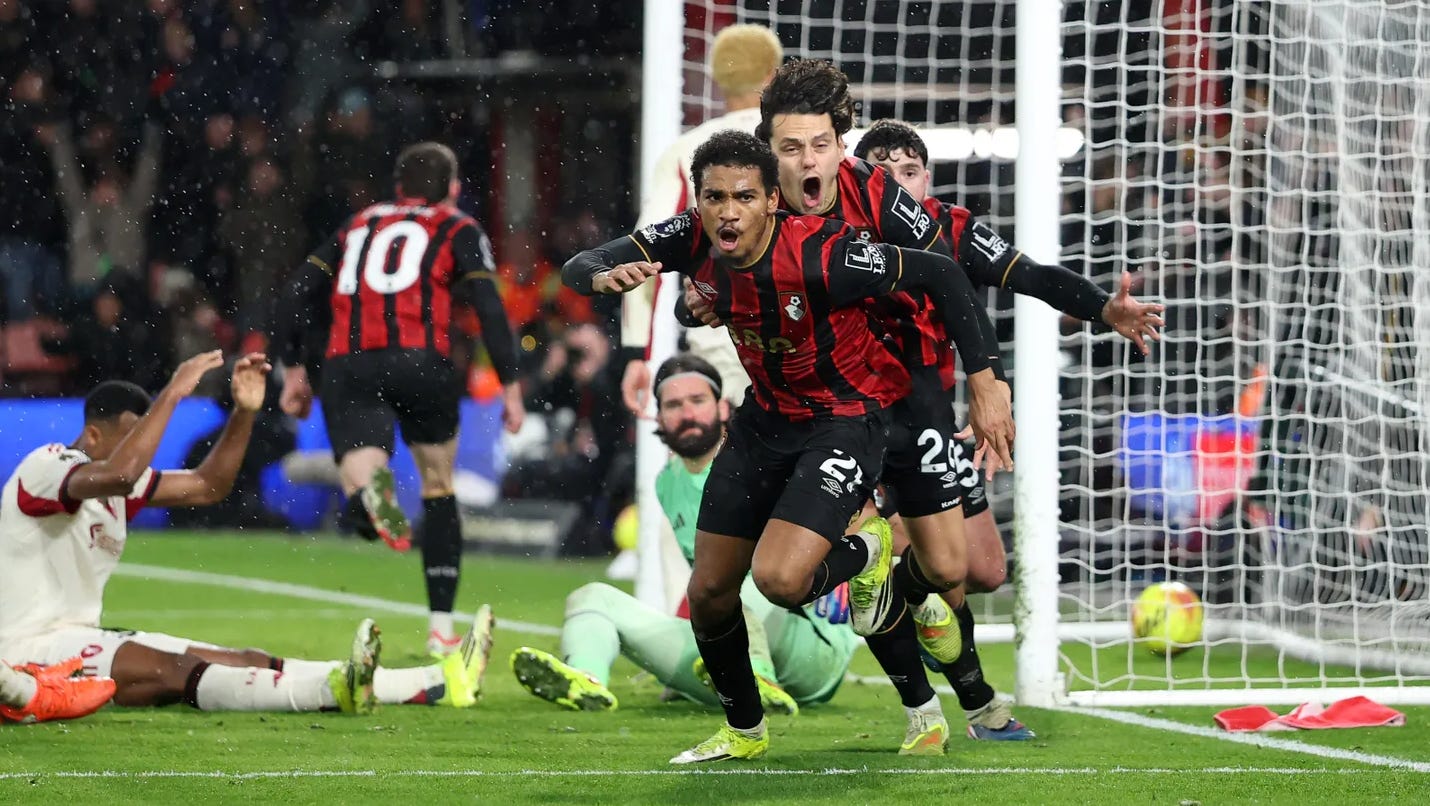
This is what Andoni Iraola said after the Liverpool game:
“I think we have Antoine (Semenyo) before, now we have James Hill. I don’t think we have anyone else. So, I think it’s good that Hilly can help us in those situations.”
They indeed scored their winner against Liverpool from a long throw-in routine. The importance of long throws has skyrocketed in the past few months. They result in these ugly goals from scrummage, or when someone picks up a second ball, and then something not-that-pretty happens.
Looking at GW23 in the previous season, there were 22 goals from long throws (from 24.5 xG and 212 shots), with Brentford scoring 6 of them.
They are always ahead of the curve when it comes to set pieces, as it dates all the way back to those Ted Knutson days at the club.
This season, there are already 44 goals, 47.2 xG, and 440 shots 🤯
Yes, the number of goals and xG from long throws has doubled.
The number of shots has risen by 108%.
And it’s no longer just about Brentford and a few other teams that use it occasionally. More and more teams are adopting those routines. Brentford, Newcastle, Bournemouth, and Burnley have already scored 5 goals each. Leeds are on four. City, United, and Everton have three goals each.
In terms of xG created from them:
Newcastle: 8 xG
Palace: 5.80 xG
Bournemouth: 4.70 xG
Leeds: 4.60 xG
Brentford: 3.90 xG
Manchester United: 3.80 xG
As for the most vulnerable teams: Spurs, Burnley, Liverpool, Bournemouth, Brentford, Crystal Palace, and, interestingly, Newcastle.
Why are teams hopping on this trend? It’s another way to fight the big boys or find an edge in even games.
And that’s not all, folks.
More shocking numbers are coming.
